
How Do Investors Use Accounting Information
 Rohit Kapoor
In the bustling world of finance and investment, knowledge is power. And when it comes to making informed investment decisions, accounting information serves as the bedrock of that power.
But how exactly do investors harness this wealth of data to guide their choices?
Let's dive into the intricate world of financial statements, ratios, and analysis to uncover the secrets of successful investing.
Accounting information isn't just a collection of numbers on a page.
It's a window into the financial health, performance, and potential of a company. For investors, this data is like a compass, helping them navigate the complex terrain of the stock market and other investment opportunities.
By understanding how to read and interpret accounting information, investors can make more informed decisions, potentially increasing their chances of success and minimizing risks.
Key Financial Statements Investors Rely On
Before we delve into the nitty-gritty of how investors use accounting information, let's first familiarize ourselves with the three main financial statements that form the cornerstone of financial analysis.
Income Statement
The income statement, also known as the profit and loss statement, is like a report card for a company's financial performance over a specific period. It shows how much money a company made (revenue) and how much it spent (expenses) to generate that revenue.
Understanding Revenue and Expenses
Revenue is the total amount of money a company brings in from its core business activities. It's the top line of the income statement and gives investors an idea of the company's market share and growth potential.
Expenses, on the other hand, show how much it costs to run the business. By comparing revenue to expenses, investors can get a sense of how efficiently a company is operating.
Example:
In 2023, Tesla's income statement revealed significant growth in revenue, largely due to increased vehicle deliveries and expanded production capacity.
Despite rising costs associated with raw materials and supply chain disruptions, Tesla managed to maintain a healthy profit margin by increasing vehicle prices and improving operational efficiencies.
Investors closely monitored these figures, particularly as Tesla navigated the challenges posed by global economic conditions.
Net Income and Earnings Per Share (EPS)
At the bottom of the income statement, you'll find net income - the famous "bottom line." This figure represents the profit (or loss) a company has made after all expenses have been deducted from revenue. Investors often look at net income growth over time as an indicator of a company's profitability and potential for future success.
Earnings Per Share (EPS) is another crucial metric derived from the income statement. It's calculated by dividing net income by the number of outstanding shares.
EPS is a key figure in many valuation models and is often used to compare companies within the same industry.
Example:
Apple's Q4 2023 earnings report showcased a rise in net income, driven by strong iPhone sales and growth in services revenue.
Despite a slight decline in the hardware segment, Apple's EPS exceeded market expectations, reflecting the company's ability to generate profit even in a saturated smartphone market.
Investors used this data to reaffirm their confidence in Apple's long-term profitability and market leadership.
Balance Sheet
If the income statement is a report card, think of the balance sheet as a snapshot of a company's financial position at a specific point in time. It provides a clear picture of what a company owns (assets), what it owes (liabilities), and the difference between the two (equity).
Assets, Liabilities, and Equity
Assets include everything a company owns that has value, from cash and inventory to buildings and patents. Liabilities represent the company's financial obligations, such as loans, accounts payable, and bonds. Equity is the residual interest in the assets after deducting liabilities - essentially, it's what would be left for shareholders if all assets were liquidated and all debts paid off.
Example:
Amazon's 2023 balance sheet displayed a substantial increase in assets, particularly in inventory and fulfillment centers, indicating preparation for future demand surges.
However, the company also reported a rise in liabilities due to increased borrowing to finance these expansions. Investors analyzed these changes to assess Amazon's growth strategy and its impact on shareholder equity.
Evaluating Company Stability and Leverage
Investors use the balance sheet to assess a company's financial stability and level of leverage. A company with a strong balance sheet - more assets than liabilities and a healthy amount of equity - is generally considered more stable and less risky. On the flip side, a company with high levels of debt relative to its equity (high leverage) might be seen as riskier, although this can vary depending on the industry and the company's growth stage.
Example:
In 2023, Zoom Video Communications maintained a strong balance sheet with minimal debt and significant cash reserves.
Despite a slowdown in revenue growth post-pandemic, Zoom's low leverage reassured investors about its ability to weather potential economic downturns without compromising financial stability.
Cash Flow Statement
While the income statement shows profitability and the balance sheet shows financial position, the cash flow statement reveals how a company generates and uses its cash. This statement is crucial because a company can be profitable on paper but still struggle with cash flow issues.
Cash Flow from Operations
This section shows the cash generated from a company's core business activities. A consistently positive operating cash flow is generally a good sign, indicating that the company can sustain its operations and grow without relying on external financing.
Example:
In its 2023 financial reports, Microsoft showcased robust cash flow from operations, supported by its growing cloud business and recurring revenue streams.
This positive cash flow was crucial for Microsoft's continued investment in AI and cloud infrastructure, which investors viewed as key drivers for future growth.
Importance of Free Cash Flow
Free Cash Flow (FCF) is a key metric derived from the cash flow statement. It represents the cash left over after a company has paid for its operating expenses and capital expenditures.
Investors love FCF because it shows how much cash a company has available to return to shareholders through dividends or share buybacks, paying down debt, or reinvesting in the business.
Example:
Alphabet's (Google) 2023 cash flow statement highlighted strong free cash flow, which the company used to fund share buybacks and invest in next-generation technologies such as quantum computing.
Investors viewed Alphabet's ability to generate and utilize free cash flow as a sign of its ongoing financial strength and commitment to returning value to shareholders.
Investing and Financing Cash Flow Insights
The investing section of the cash flow statement shows how much a company is spending on long-term investments, like property or equipment. The financing section reveals how the company is funding its operations and growth, whether through debt, equity, or retained earnings. These sections can provide valuable insights into a company's growth strategy and financial management approach.
How Investors Use Accounting Information for Analysis
Now that we've covered the basic financial statements, let's explore how investors put this information to work in their analysis.
Ratio Analysis
Ratios are powerful tools that allow investors to compare companies of different sizes and across different industries. They provide a standardized way to evaluate various aspects of a company's financial health and performance.
Profitability Ratios (e.g., Net Profit Margin, ROE)
Profitability ratios help investors assess how effectively a company is generating profits. The Net Profit Margin, for instance, shows what percentage of revenue translates into profit. Return on Equity (ROE) measures how efficiently a company is using shareholders' money to generate profits.
Example:
Nvidia's 2023 net profit margin surged due to increased demand for GPUs in AI and machine learning applications.
The company's high Return on Equity (ROE) further solidified its position as a leader in the semiconductor industry, making it an attractive investment for those looking for exposure to high-growth tech sectors.
Liquidity Ratios (e.g., Current Ratio, Quick Ratio)
Liquidity ratios indicate a company's ability to meet its short-term obligations. The Current Ratio compares current assets to current liabilities, while the Quick Ratio (or Acid Test) is a more stringent measure that excludes inventory from current assets.
Solvency Ratios (e.g., Debt-to-Equity Ratio)
Solvency ratios help investors gauge a company's long-term financial health and its ability to meet long-term obligations. The Debt-to-Equity Ratio, for example, compares a company's total liabilities to its shareholders' equity, providing insight into its capital structure and level of financial risk.
Efficiency Ratios (e.g., Inventory Turnover, Asset Turnover)
Efficiency ratios measure how well a company is using its assets and managing its liabilities. Inventory Turnover shows how quickly a company is selling its inventory, while Asset Turnover indicates how efficiently a company is using its assets to generate revenue.
Evaluating Company Performance
Investors don't just look at a company's current financial position; they also analyze its performance over time and in comparison to its peers.
Historical Performance Analysis
By examining financial statements over several years, investors can identify trends in revenue growth, profitability, and cash flow. Is the company consistently growing its revenue and profits? Are margins improving over time? These historical trends can provide valuable insights into a company's trajectory and management effectiveness.
Example:
Over the past five years, Netflix's revenue growth has been consistently strong, but its profitability has been a point of concern.
In 2023, the company's profitability showed signs of improvement, thanks to cost-cutting measures and a crackdown on password sharing. Investors analyzing these trends saw Netflix's efforts to balance growth with profitability as a positive development.
Industry Benchmarking and Comparisons
No company exists in a vacuum. To truly understand a company's performance, investors compare its financial metrics to those of its competitors and industry averages. This benchmarking helps investors identify whether a company is outperforming or underperforming relative to its peers.
Example:
In 2023, Coca-Cola out performed many of its peers in the beverage industry in terms of revenue growth and margin expansion.
Investors compared Coca-Cola's financial metrics to those of PepsiCo and other competitors, concluding that Coca-Cola's strategic focus on non-carbonated beverages and emerging markets gave it a competitive edge.
Understanding Market Position and Competitive Edge
Financial statements can also provide clues about a company's market position and competitive advantages. High profit margins compared to industry peers might indicate a strong brand or technological edge. Rapid revenue growth could suggest a company is gaining market share.
Forecasting and Valuation
Ultimately, investing is about the future, not just the past. Investors use accounting information as a foundation for projecting a company's future performance and determining its value.
Using Earnings to Project Future Growth
Historical earnings trends, combined with other financial data and industry knowledge, help investors estimate a company's future earnings potential. This forms the basis for many valuation models.
Example:
Analysts used 2023 earnings data from companies like Meta (formerly Facebook) to project future growth in the metaverse and virtual reality sectors.
Despite short-term earnings volatility, the long-term growth potential in these emerging markets drove positive sentiment among investors.
Valuation Metrics (P/E Ratio, P/B Ratio)
Investors use various ratios to assess whether a stock is overvalued or undervalued. The Price-to-Earnings (P/E) ratio compares a company's stock price to its earnings per share, while the Price-to-Book (P/B) ratio compares the stock price to the company's book value per share.
Example: In 2023, the P/E ratio of Tesla fluctuated significantly due to market volatility and investor sentiment surrounding electric vehicles (EVs).
Despite high valuation ratios, many investors remained bullish on Tesla, betting on the company's long-term dominance in the EV market.
Dividend Analysis and Long-term Value
For income-focused investors, analyzing a company's dividend history, payout ratio, and cash flow is crucial. These factors help determine the sustainability and potential growth of dividend payments.
Advanced Considerations in Using Accounting Information
As investors become more sophisticated in their analysis, they start to consider more nuanced aspects of accounting information.
Understanding and Adjusting for Accounting Policies
Not all accounting information is created equal. Different accounting standards and company-specific policies can significantly impact financial statements.
Impact of GAAP/IFRS Differences
Companies in different countries may use different accounting standards, primarily Generally Accepted Accounting Principles (GAAP) in the U.S. or International Financial Reporting Standards (IFRS) elsewhere. These differences can affect how certain items are reported, making direct comparisons challenging.
Example:
In 2023, differences in GAAP and IFRS reporting standards led to variations in revenue recognition for multinational companies like Unilever.
Investors had to adjust their analysis to account for these differences, particularly when comparing financial results across regions with different accounting standards.
Adjusting for Non-Recurring Items and One-Offs
Savvy investors often adjust financial statements to exclude one-time events or non-recurring items. This allows for a clearer picture of the company's ongoing operational performance.
The Role of Corporate Transparency
The quality and reliability of accounting information are just as important as the numbers themselves.
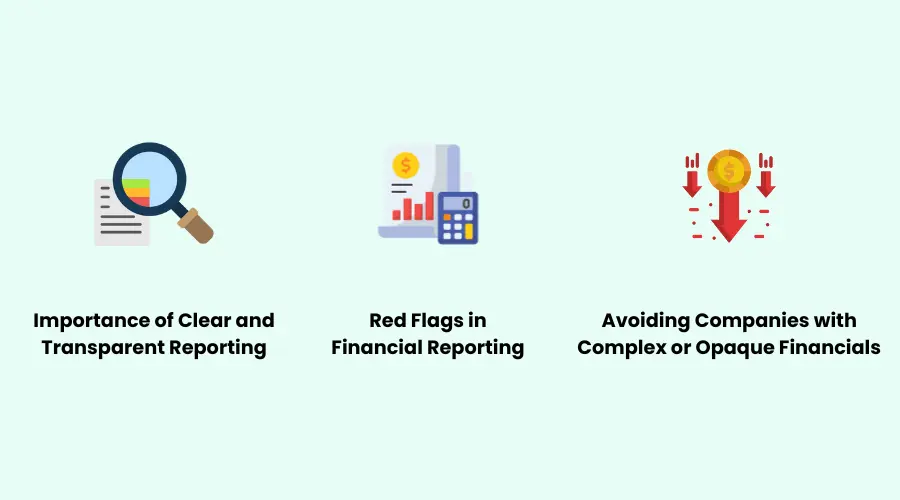
Importance of Clear and Transparent Reporting
Companies that provide clear, detailed financial reports and management discussions are often viewed more favorably by investors. Transparency builds trust and reduces uncertainty.
Red Flags in Financial Reporting
Investors should be on the lookout for warning signs in financial reports. Frequent restatements of earnings, unexplained changes in accounting methods, or discrepancies between reported earnings and cash flow can all be red flags.
Avoiding Companies with Complex or Opaque Financials
Warren Buffett famously advised investors to avoid companies they don't understand. Companies with overly complex financial structures or opaque reporting practices may be best avoided, especially for less experienced investors.
Common Pitfalls for Investors
Even experienced investors can fall into traps when analyzing accounting information. Here are some common pitfalls to avoid:
Over-Reliance on Specific Metrics
While ratios and metrics are useful tools, they shouldn't be used in isolation. A company might have an attractive P/E ratio, for instance, but if its debt levels are unsustainable, it could still be a risky investment.
Example:
During the tech stock selloff in 2023, investors who focused solely on high P/E ratios missed the broader context of rising interest rates and slowing growth in the sector.
This highlighted the risk of over-relying on a single metric without considering macroeconomic factors and company-specific fundamentals.
Ignoring Qualitative Factors
Numbers don't tell the whole story. Qualitative factors like management quality, brand strength, and industry trends are crucial considerations that don't always show up in financial statements.
Misinterpretation of Accounting Jargon
Accounting has its own language, and misunderstanding key terms or concepts can lead to poor investment decisions. It's important for investors to continually educate themselves on accounting principles and financial analysis techniques.
Conclusion
Accounting information is a powerful tool in the investor's arsenal, providing crucial insights into a company's financial health, performance, and potential. By understanding how to read and interpret financial statements, calculate and analyze key ratios, and consider both quantitative and qualitative factors, investors can make more informed decisions and potentially improve their investment outcomes.
Investor's Checklist:
- Check Financial Statements: Income, Balance Sheet, Cash Flow.
- Use Key Ratios: Profitability, Liquidity, Solvency, Efficiency.
- Analyze Performance: Trends over time, Competitor benchmarking.
- Valuation & Forecast: Project growth, Use P/E and P/B ratios.
- Check Accounting Policies: Adjust for non-recurring items, Ensure transparency.
- Watch for Red Flags: Avoid complex or unclear financials.
- Balance Metrics with Insights: Consider management and industry trends.
Successful investing requires a holistic approach that combines financial analysis with industry knowledge, macroeconomic considerations, and a clear understanding of one's own investment goals and risk tolerance.
Keep honing your skills, stay curious, and approach every investment with a critical and analytical mindset. After all, in the world of investing, knowledge truly is power.

About the Author
This article was written by Rohit Kapoor, Co-founder of Accounti. With over 20 years of experience in leading finance operations at global organizations such as Credit Suisse and Capgemini, I bring expertise in financial operations, management reporting, and finance transformation. As a Chartered Accountant, my focus is on simplifying complex financial processes, enhancing efficiency, and implementing scalable solutions that support the growth of businesses. My approach combines strategic insight with hands-on execution to deliver sustainable financial frameworks for organizations across industries.
